
A casual observer of the debates within urban and regional studies on the nature and use of computational methods might surmise that either we are living in an era of glorious, novel, big data with such a flood of empirical evidence as to bring about the “end of theory” (Anderson, 2008), or we are living a hellish techno-dystopian nightmare of saturated surveillance and data collection, reproducing algorithmic bias in turn. For those seeking a grounded perspective on how these data collection and processing technologies may re-shape their thinking and approach to understanding urban processes, neither of these (albeit strawman) dichotomies is very helpful.
For one thing, there is richness in large data sources that go beyond what we can intentionally measure through more qualitative means and traditional data sources, such as a population census. In their 2000 book Sorting things out: Classification and its consequences, Geoffrey Bowker and Susan Leigh Star (2000) describe how intentional measurement and categorization have always been complicated by the wider socio-political context under which they were created. For instance, Deborah Thompson (2016) shows in The Schematic State that racial projects operating alongside the census, such as slavery and colonialism, impacted the creation and classification of race in the United States differently than in Canada or the U.K. In contrast, big data, given the happenstance way in they are created from your mobile phone locations, taxi rides, social media presence, or subway turnstile uses, amongst other sources, often lack these explicit and careful categorizations (often to the great frustration of their users), and can avoid some of these types of preexisting biases. Moreover, moving beyond survey or census information allows us to observe a more dynamic set of social contexts and land uses as well as developing greater spatial-temporal nuance in these contexts (Kwan, 2013; Reades et al., 2007; Calabrese et al., 2013).
And anyhow, why must the richness of triangulation and more inductive methods, integrating more heterogeneous types and sources of information, be only in the purview of qualitative scholars? Central to theoretical frameworks such as advocacy planning and feminist planning are diversifying types of stakeholders, channels of communication, and ways of knowing. A similar movement to understand the heterogeneity of space and the specificity and uniqueness of place also developed in geography as a reaction to overly rational spatial logics (Massey, 2010; Tuan, 1977). Why not consider computation methods and big data as just a few ways amongst others that can shed light on the conditions and patterns of social activities and the way that heterogeneity of place can be brought to clearer delineation?
Building on these ideas, our Urban Data Research Lab investigates enduring questions of neighborhood change through advances in spatially-explicit computational techniques and novel spatial data sources.
For example cell phone data of people’s daily movement locations and machine learning allows us to study social segregation dynamics typically investigated through more qualitative methods or lower resolution quantitative methods. One study looks at how the day-to-day activities of people informs their exposure to diverse social contexts (Xu, 2021). I find that social interaction potential in Chicago, even in neighborhoods deemed hyper-segregated by traditional Census measurements, is generally more diverse and spatially heterogeneous than what is represented by traditional measurements using Census data. Using similar methods, we have created a national-wide diversity dataset called the National Experienced Racial-ethnic Diversity (NERD) dataset (Xu et al. 2024).
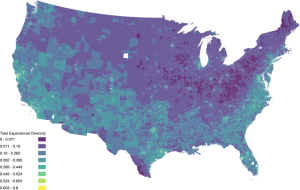
Experienced racial and ethnic diversity for weekday afternoons, as derived from cell phone mobility data
One reason for this direction is that the measurements social scientists typically use to understand racial-ethnic segregation in the United States, and the ones that are then subsequently applied in public policy, are largely based on the Census and only reflect segregation as understood through residential location. This leaves out the social contexts experienced throughout the course of the day such as when we go to work, pick up kids from school, go to the gym, or the myriad other daily activities that might occur outside of the census tract in which we live.
And what’s at stake? In terms of housing and land use, the way that Affirmatively Furthering Fair Housing – the legal mandate in the U.S. to actively advance the 1968 Fair Housing Act – is enacted in subsidized housing today is through the principle that income mixing is the solution to the harms of concentrated poverty (weaker social networks, higher exposure to crime and disorder, fewer institutional resources)(Wilson, 1987). The HOPE VI program, which demolished these concentrated poverty public housing developments and replaced them with a combination of mixed income developments and vouchers, was based on this principle. The Low-Income Housing Tax Credit (LIHTC), which helps to fund around 90% of all new subsidized affordable rentals, has seen many states adjust their Qualified Allocation Plan (QAP) – the state-level policy that determines how each state uses their LIHTC funds – to encourage construction in “high opportunity areas”. Whether these programs have overall encouraged more integration is relatively unknown.
Still, researchers need to be sensitive to big data’s limitations. Despite the possibility that these cell phone datasets can measure the actually-existing activities and socio-spatial contexts people experience, there are the (requisite) warnings: Big data does not represent all people nor all activities. It “generally captures what is easy to ensnare” (Kitchin, 2014a, 9). There are particular, easy to ensnare perspectives of reality built into the tools of data creation. And needless to say, some things just can’t be measured. For instance, we will never be able to use big data to measure the quality and intensity of interactions and whether they might contribute meaningfully to someone’s life.
Another critique that big data is “buggy and brittle” (Townsend, 2013) – the idea that data and algorithms are filled with flaws and, therefore, readily falter in its intended use. There are at least two explanations for this: a naive and more insidious one. A naive interpretation of the reasons for data and algorithmic failure stems from the fact that algorithms, regardless of how sophisticated and “inductive”, are human designs, which are inevitably limited in imagining and encoding all anticipated scenarios. Alternatively, in Algorithsm of Oppression, Safiya Noble (2018) offers an alternative explanation that algorithmic racism and sexism are intentional in Google search results due to their profitability.
Another area of our lab’s research looks at large-scale historical housing discrimination through federal-level redlining and urban renewal in the mid-20th century United States and its impacts on housing and socioeconomic outcomes. Though these processes have been formative for the social and physical landscape of cities, they are typically looked at through case studies and histories given the lack of quantitative information data dating back into decades like the 1930s and 1940s. Over the last three years, Thomas Storrs, Kate Thomas, Jacob Faber, and I have been working on a large digitization project through Federal Housing Administration (FHA) materials from the National Archives, amongst other sources.
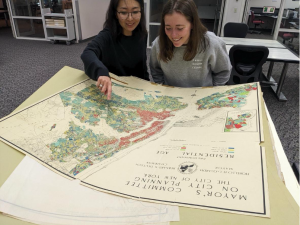
Wenfei Xu and Kate Thomas at the National Archives looking at a map of Residential Age in NYC from the 1930s. Photo: Thomas Storrs
These materials include maps and mortgage records and make up an entirely different form of novel, big data outside a conventional understanding of the term. It is only with computational tools like computer vision, which allows us to find clusters of pixels that represent a city block or a loan amount on an index (and whether that loan was guaranteed by the federal government), that we are able to collect and make sense of these thousands of records into a dataset that takes us beyond an anecdotal understanding of the FHA’s activities. This allows us to move beyond speculation and small sample accounts to measuring the broader, national socioeconomic impact of such discriminatory policies, which is (shockingly!) an emergent area of study. We have found, for instance, that the FHA mortgages bought by the Reconstruction Finance Corporation Mortgage Company (RFCMC), a proto-Fannie Mae-like government agency established in the 1930s to act as a lender to banks by buying FHA-insured mortgages, disproportionately went to white borrowers. The irony here is that the existence of many of these maps and records are the result of the predominant thinking at the time that land values and neighborhood change could be measured, modeled, and predicted, resulting in an institutionalization of ideologies that tied race and land value. Key actors such as the Homer Hoyt, the Chief Land Economist at the FHA, who developed their mortgage underwriting criteria based on the idea the neighborhood decline could be predicted through modeling, used maps and data collection as the main evidence contributing to these theories of land value.
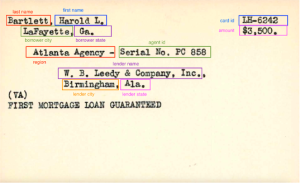
A record of a loan guaranteed by the Federal Housing Administration, with key details identified using computer vision. Credit: Kate Thomas
A danger of this type of research is confusing data about a phenomenon, which necessarily simplifies and abstracts it, with describing it more completely. The gap between description and data can be especially wide in the context of urban processes. In 1973, as the popularity urban modeling waned due to planners’ inability to accurately model urban processes and improve governance efficiencies, Horst Rittel and Melvin Webber introduced the idea of the “wicked problem” – that the social issues are complex and ill-defined, making them difficult to address and fundamentally different than scientific problems. Similarly, in the more contemporary era and writing about the “smart city”, Shannon Mattern argues in her book The City is Not a Computer that the apparent orderliness and simplicity of big data cannot reflect the complexities, especially social complexities, of urban processes.
So how can we reconcile the potential benefits of big data with this potentially harmful abstraction? Beyond dichotomous assertations of the end of theory or the end of models, data bad or data good, post-positivist scholars like Mei-Po Kwan and Elvin Wyly argue for hybrid epistemologies in which big data is one source of information amongst many, existing in a dialectical relationship with the theories and models. From the analytical side, this is foundational to the epistemology in fields such as Bayesian statistics, which takes the stance that what we know exists on a heterogeneous spectrum of uncertainty and can be continually re-assessed with more data. No result is necessarily final.
Lastly, from the perspective of urban and regional action and policy-making, the question of epistemologies is only one tool. Urban questions and planning also involve questions of normativity and equity, thus any type of analytical method can only be one of the mechanisms then employed to address these issues. The power dynamics and incremental negotiations (Flyvbjerg 1998; Lindblom 2018) can often be larger forces that shape the needs and validities of knowledge. Ultimately, we must interrogate the political objectives and institutional ideologies that shape the landscape of analytical tools.
About Wenfei Xu

Wenfei Xu is an assistant professor in GIScience and Urban Data Science in the Department of Geography at UCSB and the Director of the Urban Data Research Lab. Her interests are related to spatial big data, racial diversity and segregation, urban data science and mapping and visualization.
All essays on Counting the City
Editorial: Counting the City
María José Álvarez-Rivadulla & Andrés Mauricio Toloza
Beyond “Data Good” or “Data Bad”
Wenfei Xu
City as Data
Fábio Duarte
On pursuing a critical reasoning of the Science of Cities and their use of Big Data and AI
Ana María Jaramillo & Nandini Iyer
Cities out of data?
João Porto de Albuquerque
Published online October 2025
© 2025 THE AUTHOR. INTERNATIONAL JOURNAL OF URBAN AND REGIONAL RESEARCH, PUBLISHED BY JOHN WILEY & SONS LTD UNDER LICENSE BY URBAN RESEARCH PUBLICATIONS LIMITED
This is an open access article under the terms of the Creative Commons Attribution-NonCommercial-NoDerivs License, which permits use and distribution in any medium, provided the original work is properly cited, the use is non-commercial and no modifications or adaptations are made.