After a decade since the calls for a “data revolution”[1] and the dawn of “smart cities” discourses, digital technologies are now firmly woven into the fabric of cities worldwide. While urban residents continuously generate astonishing volumes of digital traces in their daily interaction with mobile phones and computers, they are also observed by a dense mesh of closed-circuit TV cameras, sensors and satellites — in a continuous seek to render digitally the flow of life. Recent developments in Artificial Intelligence reinvigorated imaginaries of feeding these “big data” – more recently also known as “smart data”- into computational models to simulate urban life processes in “digital twins”, which, since around a decade ago, motivated the emergence of the fields of urban analytics and urban science.
However, despite the apparent pervasiveness of data in cities, there are stark biases in how these data serve rich and poor urban areas. Data that reflects the realities and perspectives of richer citizens is much more abundant than data that reflects the priorities and worldviews of the urban poor. Data analytics built upon such biased data can “automate inequality” (Banks, 2019) by systematically misrepresenting the realities of the poorest and most disadvantaged urban areas. Algorithms of analytics and AI developed using these biased datasets will optimise goals defined from perspectives that pursue economic benefits for the few, possibly at the expense of social and environmental suffering for many. Imbalances in data literacy and digital skills mean that the most disadvantaged urban residents often benefit less from existing urban data.
Based on this scenario, I propose that we need to rethink the way urban analytics relates to inequalities and ask:
How do we know about data gaps and resulting injustices if the source of knowledge we use to understand cities is the same biased data? Is urban analytics doomed to be blind to injustices embedded in urban data gaps and therefore to perpetuate — or even exacerbate — historic marginalisation processes?
To examine this dilemma, I reflect on the expression cities out of data from different perspectives to discuss the types of urban data gaps we may encounter and how we may be able to address them with an approach I call participatory urban analytics, which combines urban data science with principles from Latin American popular education inspired by Paulo Freire.
Which cities are we reading out of data?
The fields of urban analytics and urban science emerged from the excitement of leveraging big data to build “a new science of cities” (Batty, 2013). The impetus has been to read cities out of data: the new sources of data are seen as possibilities for observing dynamic interactions and flows in cities, whereas we previously had to concentrate urban spatial analysis on more static characteristics of urban environments, relying as we were on costly processes of generating data. Now, the new sources of “smart data” are expected to fill the gaps left by existing infrastructure and processes. There are what I call first-order data gaps: gaps that arise from missing values in the intersecting rows and columns of a database — the things we know that we don’t know.
But how do these new sources of data interact with urban inequalities? The first way to think of this interaction is that they will open new ways to understand and map disparities across areas, i.e. new ways to read urban inequalities out of data. A concrete example will help us to grasp the potentials and tensions of this enterprise.
In 2013, I started to work with Brazil’s recently created Centre for Disaster Monitoring and Early Warning (CEMADEN – Centro National de Monitoramento de Desastres Naturais), motivated by successful previous studies I had done on social media related to floods in Germany (De Albuquerque et al., 2015). We were interested in exploring the idea of “citizen as sensors” by tapping into data from social media platforms, which have been extremely popular in Brazil since their inception. Leveraging them, we expected to support detecting heavy rainfall episodes that could lead to flooding and therefore cover (first-order) data gaps that emerge due to a lack of homogeneous sensing infrastructure coverage (a big challenge in a continental country like Brazil). The question we asked was: Can we detect heavy rainfall episodes based on spikes of related messages in social media?
Colleagues and I started a pilot study in the metropolitan area of São Paulo, Brazil’s biggest city, with a population of 20 million in the metropolitan region, many of them avid social media users. São Paulo has frequent issues with urban flooding, resulting from its vertiginous urban growth in the 20th Century, which saw the expansion of new neighbourhoods over the floodplains of the various water streams of the region. The challenge that my colleagues addressed was to capture the rainfall patterns using the (then still called) Twitter platform, which could then become a “virtual rainfall gauge”. Initial results of this approach were encouraging, and we showed that the combination of a signal from social media and the existing few rainfall gauges of São Paulo could be successfully used to improve the performance of hydrological models when considering rainfall at the city scale (Restrepo-Estrada et al., 2018).
However, the most interesting potential of the approach was to identify heavy rainfall episodes in the different neighbourhoods across the city, and thus overcome the (first-order) data gaps caused by having few pluviometric stations for the large urban area. To assess the extent to which social messages in Twitter/X responded to the variation of rainfall patterns at the “intra-urban” scale, we compared them with rainfall measures done by a high-resolution meteorological radar (Andrade et al., 2021).
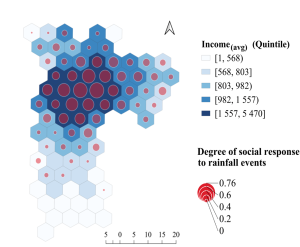
Figure 1: Map of the degree to which rainfall events are reflected in Twitter data in the city of São Paulo during the period from 7 November 2016 to 14 June 2017.
Which cities are we leaving out of data?
Figure 1 shows a map of São Paulo with a grid of hexagons that are coloured in blue shades according to the average household income of the corresponding area of the city. This is a traditional way of mapping urban inequalities, from which we can see that São Paulo has a strongly segregated radial pattern, with wealthier areas (dark shades) concentrated in the city centre, and areas of lower household income (lighter shades) towards the periphery. The overlay red bubbles depict the level of association we calculated between the volume of rain-related messages in Twitter/X and the measures of the rainfall radar: the bigger the bubble, the higher the coincidence of social media activity with actual rainfall (as estimated by the radar). Clearly, social media captured rainfall episodes fairly well — but only in the central, wealthier areas of the city. For the most impoverished neighbourhoods of São Paulo towards the city edges, there is scant correlation between rain-related social media activity and actual rain.
By investigating this further, we established that these variations cannot be explained by resident population concentration or the level of access to mobile phones: many of the peripheral areas have roughly as many social media users as the central ones. Surprisingly, at first, the association between rainfall and social media has proved strongly related to the city’s commuting patterns. Central, wealthy areas of São Paulo concentrate most employment opportunities, attracting many residents of peripheral neighbourhoods to travel there daily to work. It is during daytime that most people use social media, so the increased fluctuating population in the central areas makes them well-covered by “citizens as sensors” that capture rainfall in social media activity, whilst at the same time, the peripheral areas become “sensor deserts”.
This example shows that the social processes underlying data generation interplay with urban inequalities in complex ways. It challenges discourses about “digital divides” that would result from impoverished populations being excluded from accessing and using digital devices — an assumption easily falsified with a short visit to a favela or barrio popular in several cities of the Global South. As Jonathan Cinammon correctly observed, digital inequalities do not merely “mirror” extant social and economic inequalities; they interplay with entrenched disadvantages to engender data inequalities concerning access, control of digital flows and how issues are represented through data (Cinnamon, 2020).
Therefore, if we were to use social media data as originally envisaged, we would sense the rainfall of the rich but not of the poor urban areas. A new, emerging source of data, which was aimed to be more inclusive by filling the (first-order) data gaps in the conventional sensing infrastructure, could create a different type of exclusion, leaving a significant and historically neglected part of city life out of data.
Which cities are we making out of data?
In the intertwined urban processes embedding digital technologies, data gaps arise from the selectivity of generating data processes, which range from the daily commuting patterns of social media users to the choices of where to place sensing infrastructure. This relates to the “first-order” data gaps I mentioned before. But other types of data gaps also emerge from the practices of data generation, circulation and usage. For instance, from the choices of how to frame issues: who defines what counts as data? Whose values are represented in the data, and whose values are excluded? These questions related to a “politics of framing” lead to what I call second-order data gaps: they are not related to missing numbers in predefined lacunas of database schemas, but rather to the absence of a whole set of categories in those schemas underlying data collection.
Whilst some of the first-order gaps are easier to spot (and there is a whole set of statistical methods to assess whether data is missing at random), second-order gaps are harder. They are things we don’t (immediately) know that we don’t know. They frequently emerge from historic processes of marginalisation of oppressed and disadvantaged populations, which means their perspectives are systematically excluded from the processes of defining, generating and using data. Such marginalisation processes are particularly important for Global South cities, which are the locus of persistent and accentuating inequalities in the health and well-being outcomes of their inhabitants, resulting from unequal access to infrastructure and services. A recent example of this politics of framing is the recent decision of the Brazilian National Statistics Office (IBGE) to change the census terminology from “abnormal agglomerates” to “urban communities and favelas” in response to strong concerns expressed by social movements led by favela residents.
Yet, data gaps are not only related to how we label or frame “the world”, but also related to which worlds are engendered and enacted through data. Science and Technology Studies and Latin American thinking have offered a powerful critique of the Western perspective on data and the assumption that there is an independent “world out there” to be represented: not only are the categories we use to understand the world political, but also what we consider to constitute the world itself — which Ivan da Costa Marques calls “the power to define reality” (2012). The ontological dimension of data goes beyond the second-order data gaps we have seen before. In addition to the concerns of whether data accurately “capture” the world by assessing missing data or reflecting on categories underlying data (“framing politics”), we need to question which “world” is being built with and through data (“ontological politics”), and whether other worlds are being suppressed and oppressed — or if we can be inspired by what Arturo Escobar proposed “pluriversal politics” to build a world with data where “several worlds fit”.
Considering this ontological dimension, there are gaps between non-hegemonic ways of knowing, feeling and existing and the worlds enacted by data, which I’d like to call third-order data gaps. They are gaps that cannot be filled with data, since they refer to entities that are beyond our Western cosmologies inherent to data. These are things that we know that we can’t know with data.
This ontological dimension also allows us to consider that urban data and their inherent gaps are not only a more or less distorted image of urban processes; they are also actively co-constitutive of cities, making them increasingly interconnected and accelerating material and information flows across geographic scales of neighbourhoods, cities, countries and continents. This co-constitutive role of information technology in spatial urban processes was presciently and acutely analysed by the Brazilian Geographer Milton Santos, who, as early as the 1990s, stated that information now takes up the role that energy had in the past of connecting the different parts of the territory (Santos, 2020; Kitchin & Dodge, 2014).[2]
Because they enact worlds, third-order gaps also require us to consider not only which cities are we reading or leaving out of data, but also which cities are we making out of data.
If the urban world doesn’t have an existence “out there” that is separated and independent from the relations established with data, our responsibility in working with data increases. I believe we need to seriously consider the co-constitutive role of data and their complex interactions with urban inequalities when thinking and doing urban analytics. Echoing Nancy Fraser’s reflexive theory of justice (2008), I contend that in contexts of historic marginalisation, the only way to overcome blindness to recognition and representation injustices embedded in current (different types of) data gaps is for urban analytics to directly engage with oppressed and disadvantaged urban residents in participatory processes.
Can we reconfigure urban analytics by co-creating methods and tools with disadvantaged urban residents to address existing data gaps? Can these methods, tools result in more inclusive urban data and knowledge at the same time as they open pathways to transformations towards more just and desirable urban futures?
I have been asking these questions for the past few years in a programme I call participatory urban analytics in a series of projects in partnership with governments, academic institutions and disadvantaged urban communities in Latin America, Africa, and Asia. We took inspiration from the principles and practices of dialogic pedagogy proposed by the Brazilian educator Paulo Freire (2000) for popular education (“educação popular”) to broaden the focus of urban analytics to combine data science with a “pedagogical lens”, i.e., a careful concern with the modes of engagement with which citizens interact with data (Porto de Albuquerque & Almeida, 2020). Following Freire’s foundational insight, this engagement turns around the usual ways in which data and analytics are conceived and designed by firmly grounding them in the realities and ways of knowing, feeling and willing of disadvantaged citizens.
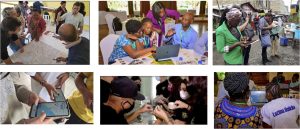
Figure 2: Participatory Urban Analytics: examples of co-creating data with residents of urban communities in several countries.
For instance, in the Wateproofing Data project (De Albuquerque et al., 2023), through dialogue with residents of favelas and urban informal settlements, we co-designed a citizen science mobile app and a school curriculum to embed critical thinking about flood risks and data generation in the classroom. This approach has been used now by more than 40 schools in all regions of Brazil, and is currently being piloted with schoolteachers and students in Colombia and Burundi. Crucially, citizen data generation about rainfall and flood events in this approach is embedded in a pedagogical process aimed at acquiring critical consciousness of the relationships that underlie current situations of risk and vulnerability. To signal the shift away from an instrumentalization of citizens for “data gathering”, we proposed the metaphor of “data gardening”: generating data should be seen as part of the cultivation of critical thinking, an organic process in which the resulting data is the peak of a harvesting cycle.
But can this type of participatory urban analytics help address data gaps from situations of historic marginalisation? From the experiences in Waterproofing Data and our subsequent participatory analytics projects, we have seen evidence that, when citizens living in disadvantaged urban areas are put at the centre of a process of dialogue for the co-creation of urban data and knowledge, several pathways can be opened to address the injustices embedded in existing data gaps. I will end these reflections with a summary of these pathways into three main points, corresponding to the three types of data gaps we have seen before.
First, and most obviously, the use of data by citizen scientists can help address first-order data gaps in environmental monitoring about localised rainfall coming from artisanal rainfall gauges (made of plastic bottles) and the associated records of flooding impacts. The generated data can be transformative by producing evidence that makes visible the local rainfall precipitation and associated thresholds for it to cause impacts to communities. This is especially important for historically marginalised territories and communities that are currently underrepresented in official data.
Second, the circulation of citizen data can lead to a change in relationships with governments that contributes to reframing urban issues, modifying how they are currently dealt with in public policy and administration. This is related to second-order gaps: if floods are considered only an effect of heavy rain to “people living in the wrong place”, even if data are available, they will not lead to any meaningful change. The circulation of local knowledge from citizens about their territories through data can not only mobilise them to action, but also amplify their voice in public matters and open up communication channels that can contribute to addressing historic representative injustices.
Third, apart from the usage and circulation, the generation (or cultivation) of data can have intrinsic value in itself, as it affords a new critical consciousness and the resignification of urban issues. I’d like to propose this as a way to deal with third-order gaps — even if it may seem contradictory, as this type of gap arises from the very impossibility of data to fully “capture” some ways of knowing, feeling and existing. By generating data with communities in several places of the world, I became quite aware of those ontological gaps and how data are always what the Brazilian anthropologist Viveiros de Castro calls “controlled equivocation” (2004): rather than representations that completely capture “the reality” of communities, data are more productively seen as partial connections (adopting Marisol de la Cadena’s term (2015)) to the ways of knowing, feeling and willing of oppressed and disadvantaged urban communities. Here, a politics of radical alterity means to recognise that there are always worlds beyond data, which can be strategically and tactically associated with data to support claims to correct historic injustices and marginalisation processes.
Considering these three pathways to deal with the corresponding data gap types may be what we need to rethink participatory analytics methods and tools, so that they are truly more equitable and transformative. Perhaps this implies that instead of an indiscriminate quest to fill all data gaps by resorting to new and “smart” sources, we adopt a more cautious approach: engaging citizens living in historically marginalised urban areas, we can carefully consider the existing types of data gaps and co-create data systems and analytics algorithms that are effectively liberating from oppressive structures but also respectful of diverse ways of knowing, feeling and existing of various urban communities. It could be that this is an analogous approach to that adopted by some subways around the world: conscious that it is not always possible to fully prevent gaps between the platforms and the trains in every station, they adopt a warning message to passengers, which we could translate to a useful accompanying motto for urban analytics: “mind the data gaps”.
About João Porto de Albuquerque

João Porto de Albuquerque is Director of the Urban Big Data Centre (UBDC) and Professor in Urban Analytics at the Division of Urban Studies and Social Policy in the School of Social and Political Sciences at the University of Glasgow. Is a geographer and computer scientist with an interdisciplinary background who researches geographic information and urban sustainability, focusing on addressing inequalities in data and society.
[1] A “data revolution” was first called in 2013 in a Communiqué of the High‐Level Panel of Eminent Persons tasked by the United Nations General Secretary Ban Ki-Moon to draw recommendations for the Post‐2015 Development Agenda, which were compiled in a Report (HLP, 2013) that gave strong prominence to the importance to “take advantage of new technology, crowd sourcing, and improved connectivity to empower people with information on the progress towards the [sustainable development] targets.” (p. 21).
[2] Milton Santos developed an extremely original thought on the role of technology and particularly information for spatial processes, which is formulated in its most extensive form in a book recently translated into English: A Natureza do Espaço: Técnica e Tempo. Razão e Emoção. Also, the constitutive role of technology in space was also a topic by British Geographers Rob Kitchin and Martin Dodge’s book “Code/space” two decades later”.
All essays on Counting the City
Editorial: Counting the City
María José Álvarez-Rivadulla & Andrés Mauricio Toloza
Beyond “Data Good” or “Data Bad”
Wenfei Xu
City as Data
Fábio Duarte
On pursuing a critical reasoning of the Science of Cities and their use of Big Data and AI
Ana María Jaramillo & Nandini Iyer
Cities out of data?
João Porto de Albuquerque
Published online October 2025
© 2025 THE AUTHOR. INTERNATIONAL JOURNAL OF URBAN AND REGIONAL RESEARCH, PUBLISHED BY JOHN WILEY & SONS LTD UNDER LICENSE BY URBAN RESEARCH PUBLICATIONS LIMITED
This is an open access article under the terms of the Creative Commons Attribution-NonCommercial-NoDerivs License, which permits use and distribution in any medium, provided the original work is properly cited, the use is non-commercial and no modifications or adaptations are made.